AI Stats
Cortex reporting is available within the AI Stats link in the left navigation. From here, you can view performance by Stages, Blasts, Overview, and Cortex Flow. This page breaks down each of these sections.
Overview Tab

**past 14 days
Top Products and Categories: Top products & categories from Cortex sends over the past 14 days. It is not based on overall unit count, but rather reporting the number of orders that contain that item.


Geography: See the states with the highest and lowest number of users, as well as total revenue and average revenue for users by state.

Average Time to 1st Purchase: For all users who had a signup date within the past 6 months, targeted by Cortex over the past 6 months, what the average time to first purchase is.
Average Time to Repeat Purchase: For all users who had a signup date within the past 6 months, targeted by Cortex over the past 6 months, what the average time to second purchase is.
1st Purchase Conversion Rate: First purchase conversions are based off the number of emails that are sent to users who have made zero purchases and they signed up within the past 6 months, what the rate to first purchase is of those users.
Repeat Purchase Conversion Rate: Repeat conversions are based off of the number of emails sent to users who have placed at least one order and they signed up within the past 6 months, what the rate to another purchase is of those users.

Stages Tab
Select the timeframe you wish to view your Cortex performance stats

Totals
Combined performance of all your Cortex stages, over the time frame chosen for reporting. (does not include Promo or Smart Blasts)

Header definitions
Emails: Number of emails sent.
Revenue: Amount of revenue generated from this stage.
Key Trends
Charts illustrating comparisons like emails sent vs. revenue. Additional options in the drop downs.

Stage Performance
Performance of each stage with Cortex. See how each stage performs as a whole.

Content Performance
Drill it down even further. See how each email is performing within each stage.

And how each subject line is performing within the selected stage.

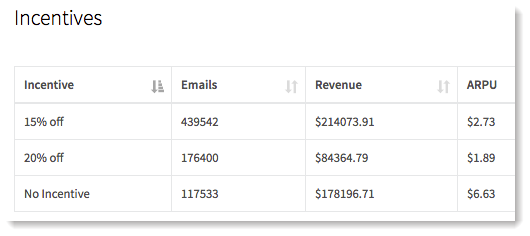
And how each incentive is performing within the selected stage.

Daily Performance
Can view daily performance by individual stages or all stages.

Header definitions
Emails: Number of emails sent.
Delivered: Number of emails that reached a recipient.
Revenue: Amount of revenue generated.
ARPU: Average revenue per user.
AOV: Average order value.
AIPO: Average item per order.
Convs: Number of conversions generated.
COR: Conversion rate (number of conversions divided by your attribution action [clicks or opens]).
CTOR: Click to open rate (clicks divided by opens).
Opens: Number of unique emails opened.
Open rate: Percentage of emails opened.
Clicks: Number of unique clicks generated.
Click rate: Percentage of clicks generated against emails sent.
Blast Tab
Totals
Combined performance of all your Blasts, over the time frame chosen for reporting.

Key Trends
Charts illustrating comparisons like emails sent vs. revenue. Additional options in the drop downs.

Daily Performance
Can view daily performance by individual blasts.

Cortex Flow Tab
This tab shows a dendrogram illustrating the flow of users from one Cortex stage to the other, following users through their lifecycle.

Resources:
Learn more about the Report Builder here
Comments
0 comments
Please sign in to leave a comment.