Understanding the performance of your Promo and Smart Blasts is essential for driving incremental improvement over time. Retention Science makes data analysis very simple for marketers, by providing a number of ways for a marketer to look at their data and understand trends and insights that will help drive future content iterations. As a marketer, there are always things that can be done in an effort to increase open, click, and conversion rates, but what is the best way to use data to inform these efforts? In the following sections, we will highlight the different data points available to you, as well as best practice approaches for interpreting the data.
Access Blasts reporting and select data to view
Access Blasts reporting and select data to view
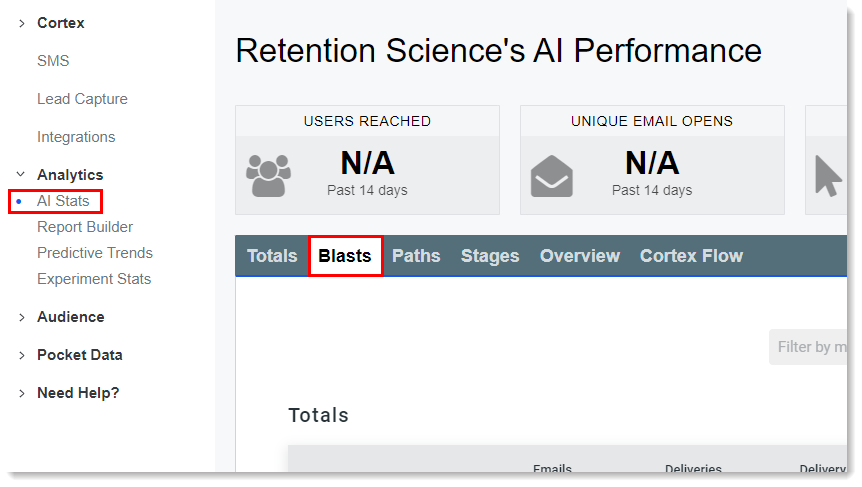
After logging into Retention Science, you will be greeted by the AI Stats page. Click the Blasts tab, where you can begin to assess campaign results.

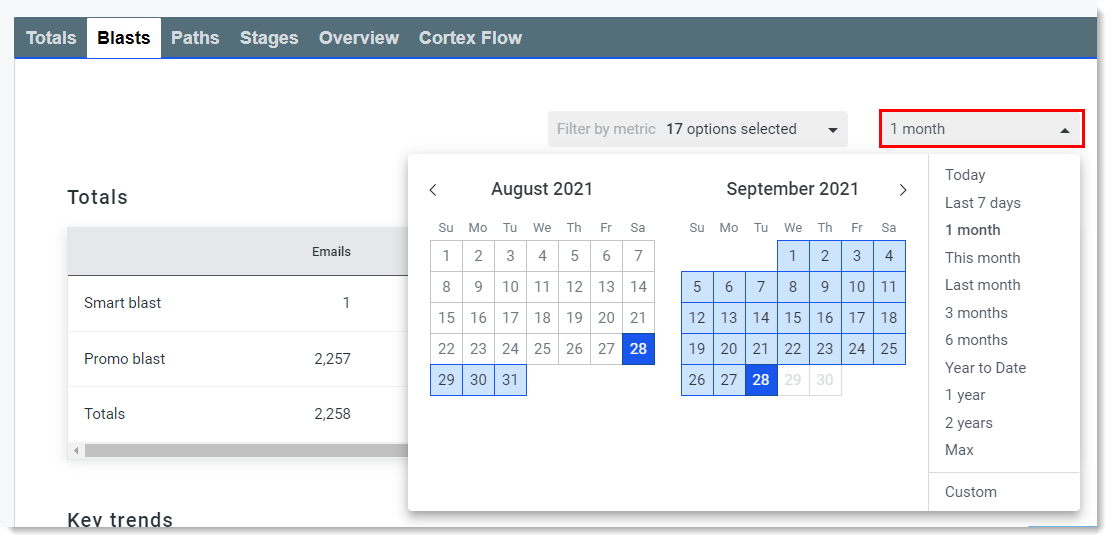
The first step is to specify the time frame for your data. This can be done using the drop down menu on the top right of the page. All data on the page will be filtered by this selection.
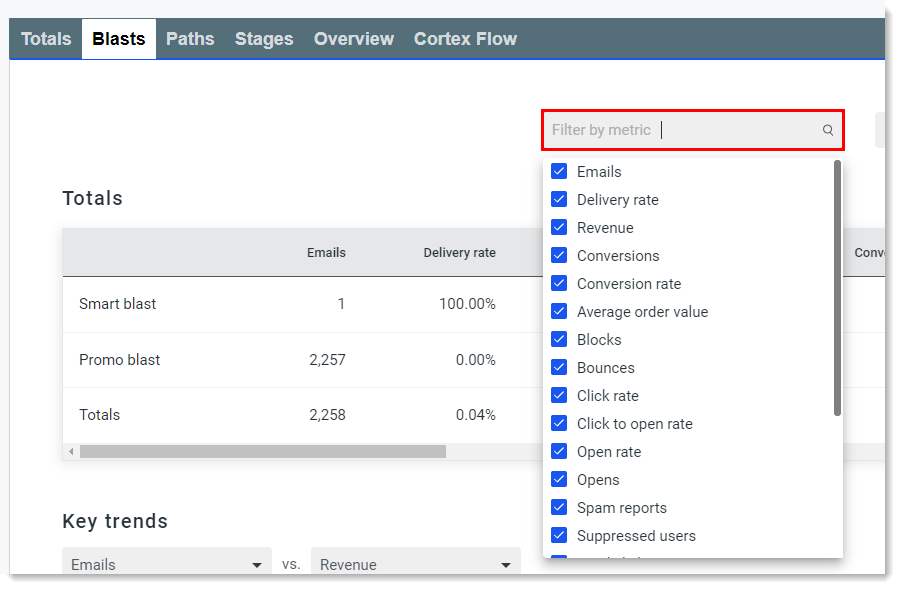
The second step is to specify which metrics you want displayed in the columns of the Totals table.
Totals Table
The data displayed in the Totals section is the combined statistics for both Smart and Promo Blasts. This data is also made available for export.

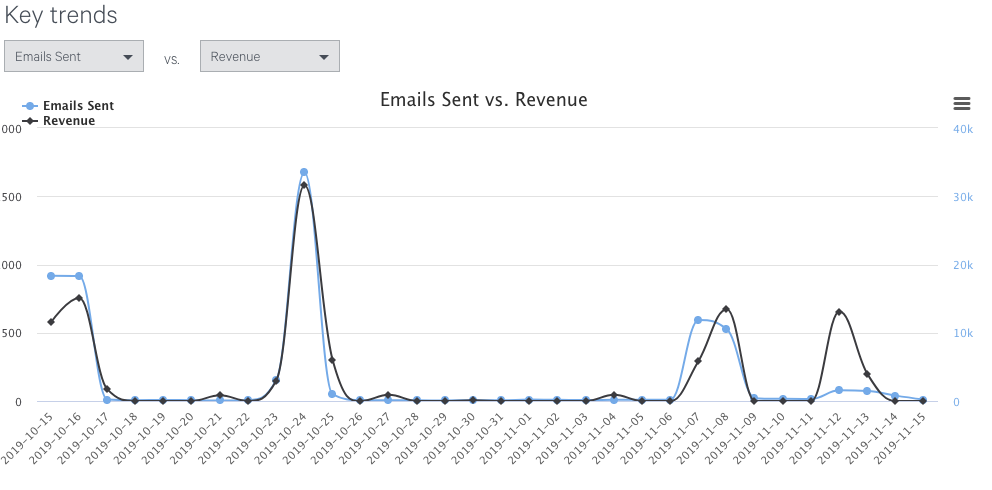
Key Trends
The data displayed in the Key Trends section allows you to visualize trends over time and compare how two different metrics are trending over the same period.

Daily Performance
The Daily Performance table lists specific Smart and Promo blasts where the start data is within the window selected in the calendar. This data is also made available for export.


Comments
0 comments
Please sign in to leave a comment.