Understanding the performance of your current campaigns and stages is essential for driving incremental improvement over time. Retention Science makes data analysis very simple for marketers, by providing a number of ways for a marketer to look at their data and understand trends and insights that will help drive future content iterations. As a marketer, there are always things that can be done in an effort to increase open, click, and conversion rates, but what is the best way to use data to inform these efforts? In the following sections, we will highlight the different data points available to you, as well as best practice approaches for interpreting the data.
Additional considerations for data analysis
What data is available to me?
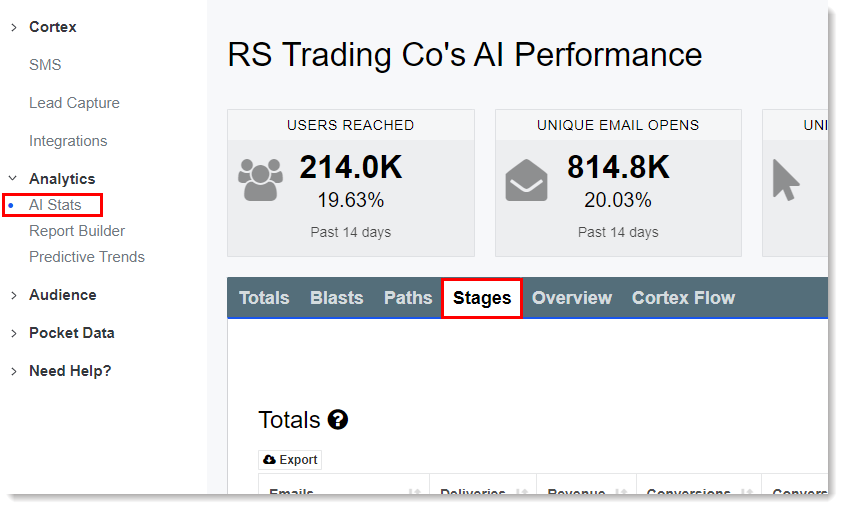
After logging into Retention Science, you will be greeted by the AI Stats page. Click the "Stages" tab to assess campaign results:
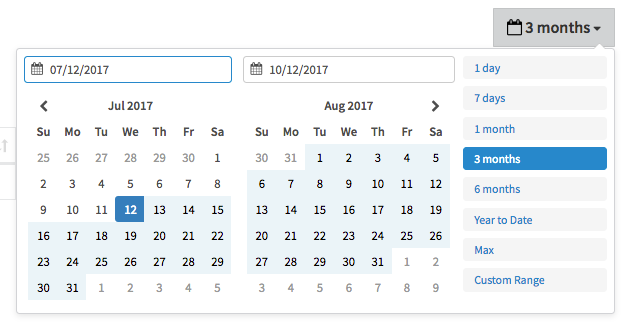
The first step is to specify the time frame for your requested data. This can be selected by using the drop down menu on the top right of the page:
There are several preset time intervals that can be selected, or you can enter a custom range by entering dates in the fields or by clicking on the calendar.
Now that your data is reflective of the time frame you have selected, you can see your data broken out in several different sections.
Totals
The data displayed in the Totals section is the combined statistics for all campaigns within Cortex (Acquisition Stages, User Triggers, Item Triggers, Lifecycle Messages, Winback Campaigns).

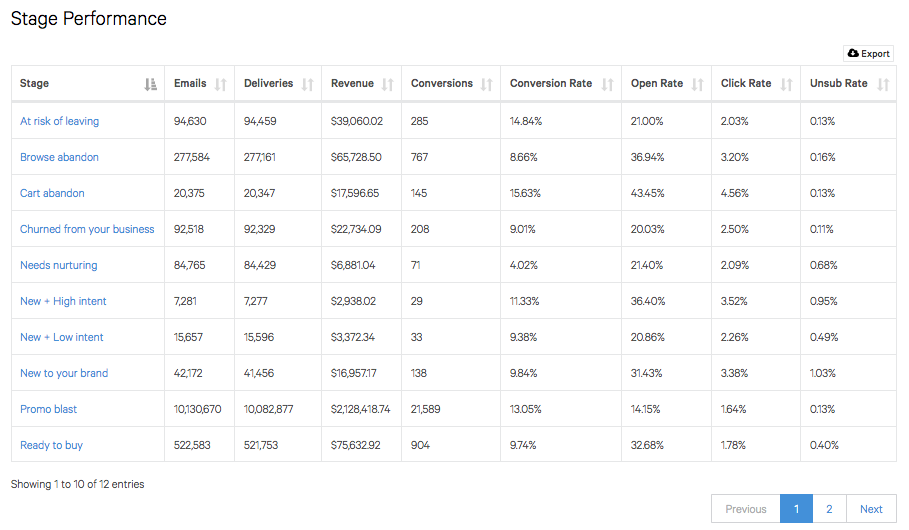
Stage Performance
This section will provide a breakdown of performance of your Cortex Campaign at a stage level. All templates within each stage will be rolled up into this section.
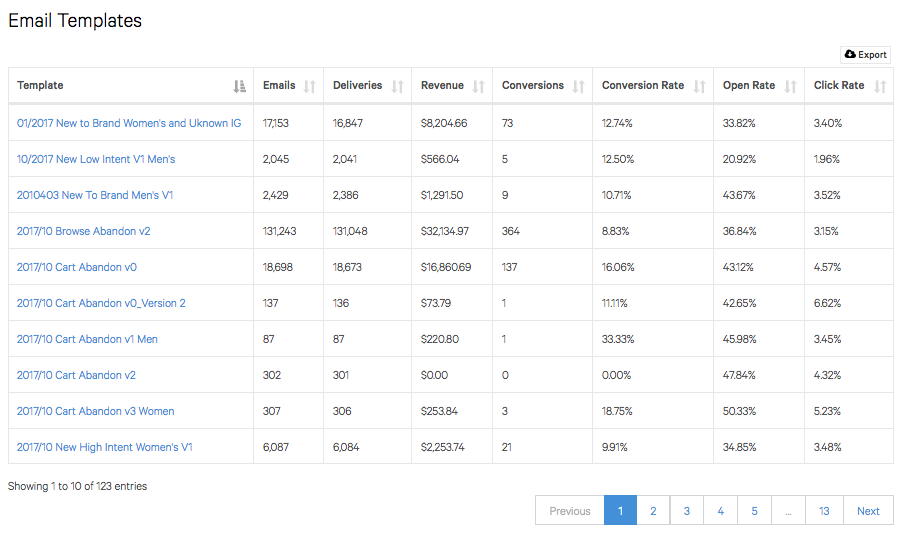
Email Templates
This section will provide a breakdown of performance of your Cortex Campaign at a template level.
Subject Lines
This section will provide a breakdown of your subject line performance.

Incentives
This section will provide a breakdown of your different incentive performance across all emails within Cortex.

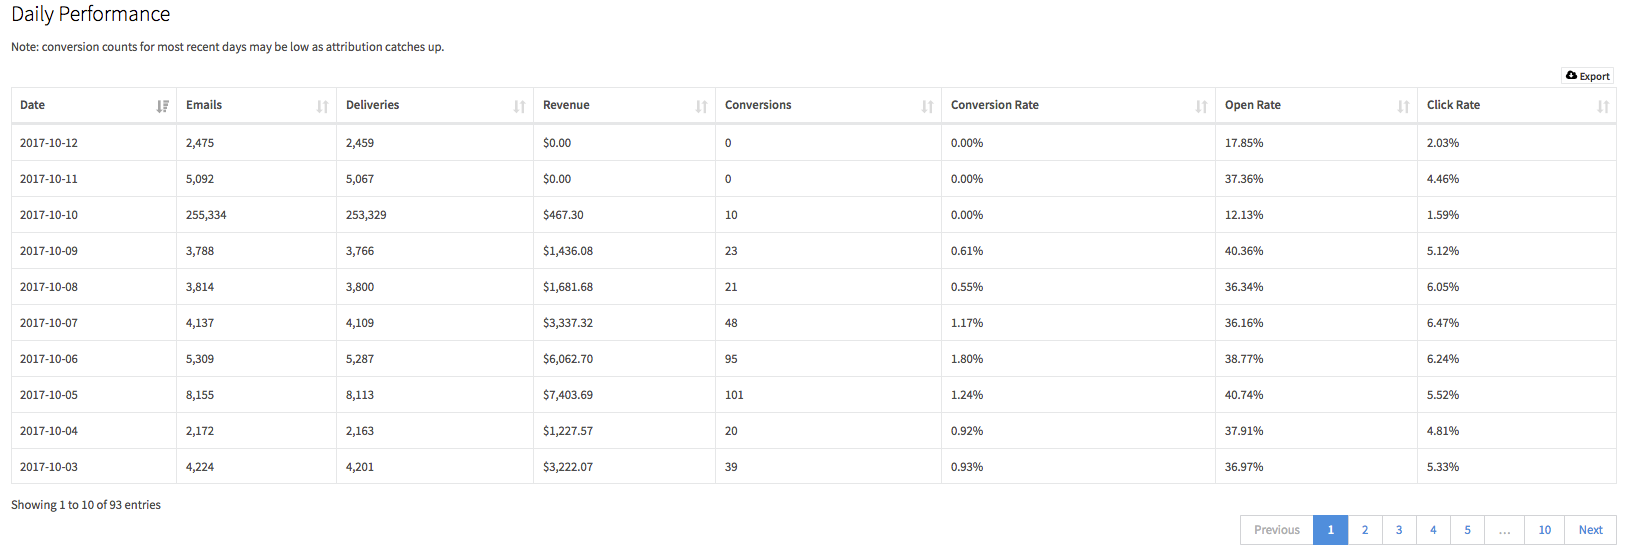
Daily Performance
This section will provide a breakdown to total sends per day across all Cortex stages.
Additional Considerations for Data Analysis
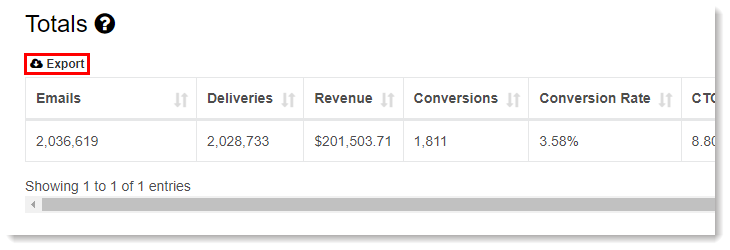
The data that is displayed in the dashboard is focused on providing high-level insight to marketers, mainly in the form of send totals and rates for conversions, opens and clicks. There is more data available to you if you export any of the available data sections. This will allow you to download a CSV file that has additional information on aggregate numbers, as well as other rates and averages such as AOV (Average Order Value) and AIPO (Average Items Per Order). You can download any of these data sets by clicking on the Export button at the top right of each chart:
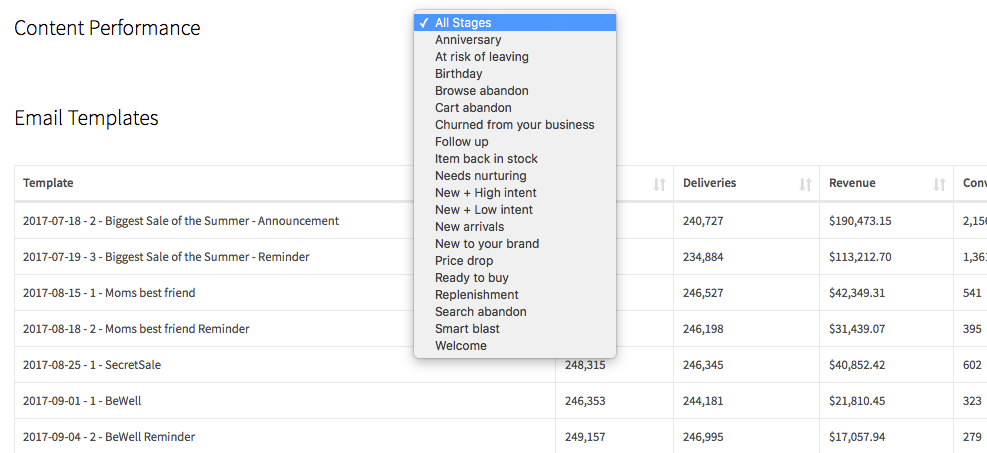
If you are using Cortex correctly, you probably have dozens of templates and subject lines in our system, and looking at those numbers can prove to be overwhelming. We try to make data analysis as simple as possible, so we have given you the ability to filter content and subject line performance by stage. Selecting a stage from the dropdown will only retrieve email and subject line performance from that particular stage.
Understanding Key Data Points
Subject Line Performance
The first step in optimizing your email campaigns is to understand what drives your users to open an email. Subject Lines are the most crucial part to this process. As a marketer, you should explore testing several different subject lines across your campaigns that, while maintaining your brand voice, test the following variables:
- Length - Try writing subject lines that vary in length. Some may be 2-3 words, while others may be a sentance.
- Capitalization - Do your users respond well to capitalized letters, or do they like the conversational feel of an all lowercase subject line? Does writing in ALL CAPS make your subject lines stand out in the users inbox?
- Punctuation - Do your users like subject lines that are statements or questions? Does an exclamation point help drive engagement? Can using something like an ellipsis create a higher chance of opens...
- Grammar - Sometimes incomplete sentences create a sense of intrigue, and can lead to increased open rates. Conversely, this can lead to a negative open rate impact if your users prefer all brand content to be sophisticated and formal.
- Personalization - Should you use First Name or Product Names in your Subject lines to further personalize their experience with your brand? Some Cart Abandon campaigns have seen open rate increases by calling out the name of the abandoned item, and directly referring to your users gives them a warm feeling that your brand knows them personally, and tries to cater the experience directly to them.
- Emojis - Can using emoji’s in your subject line help build excitement? Are their emoji’s that work best in certain stages or campaigns?
Once you’ve tried several of these methods across your Cortex campaign, you should begin to understand if any of these help increase your open rates. The higher the open rate, the more your hard work creating templates will pay off!
Template Performance
Once a user has opened the email, our next goal is to draw the user to your website. Obviously, the content that you include in these templates is paramount to getting users to click, and moving them further down the purchase funnel. Look at the templates that you are testing, and try to understand what is driving higher click rates. Does the click rate increase when your emails are more focused on educational content, like links to blogs and videos? Or does the click rate increase when the email features products, either curated by your marketing team, or through the use of Retention Science’s dynamic product recommendation? Once you understand what commonalities are driving higher click rates, you will be better able to create templates with content that has a proven record of bringing users to your store.
Acting on Your Data
After you’ve looked through your subject line and template performance, you should be able to identify trends that you can use in your next iteration of testing. Best practices are that you should disable/remove any of the under-performing content, and replace it with new, fresh content that builds upon the knowledge gained from the previous round of testing. If shorter subject lines with punctuation seemed to have worked well for you in the past, you should continue to create/write subject lines that implement these characteristics. If click rates increased when you featured product recommendations below an engaging content piece, you should make sure that this format is applied to future templates.
Learn more on reporting in ReSci here.
Comments
0 comments
Please sign in to leave a comment.